
 By Km Fazi

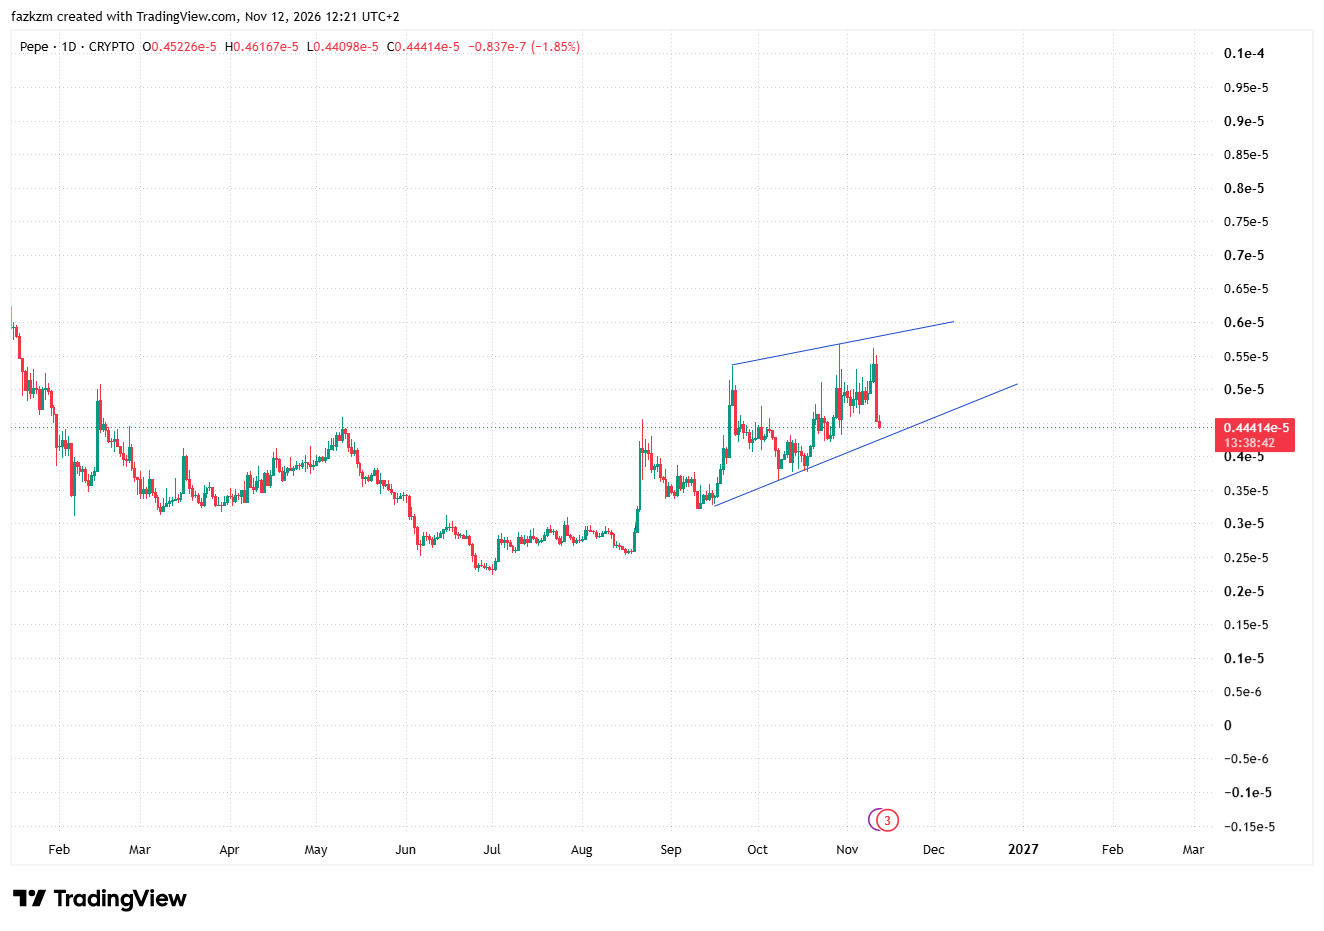
Pepe (PEPE) is approaching a critical technical level after a sharp sell-off erased much of its recent gains. The memecoin is testing the lower boundary of an ascending channel that has supported its recovery since September, raising the possibility of either a rebound or a deeper correction.
The latest decline has weakened PEPE’s short-term momentum. Traders are now watching the $0.00000425–$0.00000430 region, where rising trendline support and a previous horizontal resistance level converge.
PEPE Price Drops as Selling Pressure Returns
PEPE was trading around $0.00000444 in the TradingView chart provided on November 12, with the displayed daily candle down approximately 1.95% at the time of the screenshot.
Broader market data showed a considerably sharper decline over the preceding 24 hours. CoinGlass reported PEPE near $0.00000456, down approximately 14.6%, while its market capitalization stood around $1.88 billion. Trading volume across spot and derivatives markets also increased during the sell-off.
The decline followed a period of recovery that had pushed PEPE toward the $0.00000500 level in late October. However, sellers regained control near the upper part of the recent trading range, sending the price back toward its rising support structure.
The difference between the price displayed in an individual exchange chart and aggregated market data is normal, as prices can vary between trading pairs and platforms.
Ascending Channel Under Pressure on the Daily Chart
The daily chart shows PEPE trading inside an ascending channel that developed from September onward. The structure is defined by two upward-sloping trendlines:
- Upper resistance: The upper boundary has repeatedly limited bullish advances, with the latest rejection occurring around the $0.00000550–$0.00000570 region.
- Lower support: The rising lower boundary has acted as dynamic support during previous pullbacks.
- Current price: PEPE has fallen back toward this lower boundary, putting the continuation of the channel at risk.
The latest red candle is particularly important because the price is approaching, and appears slightly below, the lower trendline drawn on the supplied chart.
However, a temporary move below a trendline does not automatically confirm a breakdown. Traders should watch whether the daily candle closes below support and whether subsequent trading sessions can reclaim the channel.
Key PEPE Support and Resistance Levels
Several price zones could determine PEPE’s next move.
| Price level | Technical significance |
|---|---|
| $0.00000568 | Recent major resistance |
| $0.00000500 | Psychological resistance and recovery target |
| $0.00000478–$0.00000490 | Near-term resistance zone |
| $0.00000425–$0.00000430 | Critical support area |
| $0.00000364 | Potential downside target if support fails |
The $0.00000425–$0.00000430 region is especially important. Recent technical analysis published by FXStreet also identified approximately $0.00000425 as rising trendline support, with horizontal support near $0.00000423 reinforcing the area.
Bullish Scenario: Buyers Defend the Channel
If buyers successfully defend the $0.00000425–$0.00000430 support zone, PEPE could attempt to recover toward $0.00000480–$0.00000490.
A stronger recovery above $0.00000500 would improve the short-term technical outlook and potentially open the way toward the previous high near $0.00000568.
For this scenario to gain credibility, traders would want to see a daily close back above the rising trendline, followed by stronger buying volume.
Bearish Scenario: Daily Close Below Support
A confirmed daily breakdown below $0.00000423 could invalidate the current ascending-channel structure.
If selling pressure continues, the next major downside area highlighted by recent technical analysis is approximately $0.00000364, corresponding to the October 8 low.
A breakdown accompanied by increasing selling volume would strengthen the bearish case. Until that confirmation appears, however, the current move should be treated as a support test rather than a confirmed trend reversal.
Derivatives Data Shows a Bearish Shift
The derivatives market is also reflecting the recent weakness.
CoinGlass data on November 12 showed PEPE futures open interest at approximately $339 million, down around 11% over 24 hours. The weighted funding rate was negative, indicating that short positions were paying long positions to maintain their exposure.
Tracked futures liquidations during the same period were approximately $2.62 million, with the majority coming from long positions.
These figures suggest that bullish leveraged positions have faced pressure during the sell-off. However, declining open interest can also indicate that traders are reducing exposure rather than aggressively opening new short positions.
The derivatives data therefore supports a cautious short-term outlook but does not independently confirm that PEPE will continue falling.
Bitcoin Weakness Adds Pressure to Memecoins
PEPE’s decline is taking place during a broader period of weakness across the cryptocurrency market.
A November 12 market analysis published by FXStreet noted that Bitcoin had fallen below $75,000 amid stronger-than-expected US inflation data and concerns surrounding the regulatory environment.
Memecoins are particularly sensitive to changes in market sentiment because their valuations are heavily influenced by speculative demand, liquidity and community interest.
The same market analysis noted that PEPE’s year-to-date decline remained relatively limited compared with the larger losses recorded by Dogecoin and Shiba Inu. Nevertheless, its latest correction demonstrates how quickly sentiment can change when broader market conditions deteriorate.
What About PEPE Whales and ETF Developments?
There are also developments worth monitoring beyond the price chart.
According to Deep Blue Alpha’s tracked-wallet data, 110 whale wallets moved approximately $106.4 million worth of PEPE over the preceding 30 days. Its reported accumulation-side flows exceeded distribution-side flows by approximately $27.2 million.
This suggests that tracked large-wallet activity has shown an accumulation bias over that period. However, exchange withdrawals and deposits are not necessarily purchases or sales, and wallet tracking cannot establish the intentions of every large holder.
Meanwhile, Canary’s amended SEC registration statement for a proposed spot PEPE ETF remains an important longer-term development. The filing does not mean that a US spot PEPE ETF has been approved or is currently trading. Any potential launch would depend on the regulatory process.
These developments may influence market expectations, but neither guarantees an immediate price recovery.
PEPE Price Outlook: A Critical Test for the September Uptrend
PEPE is approaching an important technical decision point. The ascending channel visible on the daily chart remains relevant, but the latest sell-off has brought the lower boundary under pressure.
The $0.00000425–$0.00000430 zone is the level to watch. A successful defense could allow PEPE to recover toward $0.00000490 and potentially $0.00000500. On the other hand, a confirmed daily close below approximately $0.00000423 could expose the October low near $0.00000364.
For now, traders should look for confirmation from daily candle closes, trading volume and broader Bitcoin market conditions before assuming that either a rebound or a breakdown is underway.
This article is for informational purposes only and does not constitute investment advice. Cryptocurrency markets are volatile, and technical levels can change as new price data becomes available.